
Are you maximising the value of Sentinel for Microsoft Purview?
In practice, many organisations are not, often because they do not realise Purview can be monitored via Sentinel in the first place!
A Quick Note
Before we dive in, I am not a Sentinel or (KustoQL) Kusto Query Language expert, nor do I claim to be. I simply have a strong interest in Microsoft Purview and related technologies, which has often motivated me to think creatively when fulfilling customer requests around logging, monitoring and alerting.
The examples and experiences throughout this blog are based on what has worked well for my customers, leading to successful engagements. As a result, I am always eager to share these practical approaches with you so you can benefit from them also.
However, if you are a Sentinel or a KQL expert and know of another way to achieve the same results from the examples demonstrated below, feel free to adapt them as you see fit. In addition, if you would like to share your own examples, I would be happy to include them on my GitHub and other content I have created, where I see fit and reference your name.
Watching the Watchers
Microsoft Purview sits at the centre of an organisation’s most sensitive data and investigations. This is especially true across capabilities such as Information Protection, Data Loss Prevention, eDiscovery, Insider Risk Management, and Data Security Posture Management.
These solutions are powerful, but that power raises an important and often overlooked question: who is monitoring the access and activities of the people managing them?
In this post, I explore how ingesting Microsoft Purview Roles Based Access Control (RBAC) group and Sign In activity into Microsoft Sentinel enables SOC teams to effectively “Watch the Watchers.” By making administrative activity visible, organisations can gain confidence that Purview is being operated securely, responsibly, and in line with existing security and governance frameworks.
Drawing on real customer engagements, I’ve seen how this level of visibility helps build trust in Purview access and operations. In some cases, it has highlighted risky patterns, such as custom RBAC groups created to bypass Entra ID Privileged Identity Management (PIM) or existing audit controls, or administrators removing themselves from M365 groups used by Data Loss Prevention policies. Left unchecked, these changes can create opportunities for inappropriate or unaccountable administrative activity.
The goal is not to police administrators, but to establish transparency, traceability, and trust. When administrative actions are visible and auditable, they protect both the organisation and the individuals managing the Purview stack.
In one engagement, for example, clear and accessible audit trails allowed administrators from a Managed Security Service Partner (MSSP) to demonstrate good operational practices during external reviews, while internal leadership gained confidence that administrative actions were visible and accountable alongside their internal and security frameworks’ good practices.
Ultimately, this kind of transparency helps build a collaborative security culture where responsible access and oversight are recognised by everyone involved.
Default Purview Auditing
Let me first ensure you all: Microsoft Purview’s native audit logs are not ineffective. They provide rich, detailed telemetry across administrative and user actions and activities, and for many compliance-led investigations, they deliver exactly what is required.
Although when relying solely on the default Purview auditing experience, investigations are largely search-driven. Analysts must create multiple dedicated audit searches, often across different activity types or workloads, and then manually reason over each result set. As you can imagine, this process can become time‑consuming and is not the best approach when a rapid response is required.
The task is further heightened once audit results are exported for analysis. Reviewing activity logs in CSV or Excel format often means manually filtering rows, aligning timestamps, and stitching together individual events to reconstruct a timeline. I can share from previous experiences that attempting to piece together the sequence of actions during a suspected data breach using spreadsheets is not only slow but also introduces risk, as important context can be missed under pressure.
In addition, spreadsheets do not provide an immutable output. This can be a problem for organisations where tamper-proof logs are required for compliance or extensive reporting. Sentinel can export data into a PDF and/or into a Power BI Report to ensure data is unchangeable.
Organisations can, of course, leverage the Microsoft Graph API to extract Microsoft 365 audit data, unlocking benefits such as automation, integration with other platforms, and broader compliance use cases. However, this approach also introduces additional considerations around complexity, performance, cost, and security, and still requires organisations to design and maintain their own correlation and detection logic.
Nonetheless, in working alongside customers who already operate Microsoft Sentinel, a consistent pattern emerges. These organisations quickly recognise the additional value Sentinel brings by enabling a more targeted, proactive, and operationally efficient approach to logging, monitoring, and alerting on Purview’s administrative actions and activities.
FYI, Purview and Sentinel can do ‘WAY’ more than this! I truly feel Sentinel for Purview is massively underutilised!! Be sure to follow this blog series to find out more about what can be achieved!
This is where integrating Purview audit data into a SIEM, such as Microsoft Sentinel, fundamentally changes the experience, transferring from reactive searches to continuous monitoring, correlation, and detection of high‑risk administrative activity.
How great would it be to have Sentinel deliver these high‑risk administrative actions and activities from administrators directly into your SOC’s email address and or Team Channel, containing all the important data to act on with urgency? This reduces alert-fatigue, enabling them to concentrate on other important matters, springing into action when they see the risky admin’s email and/or teams message pop-up.
Amazing, right…? I agree! “Hence this blog!”
Important Note: Don’t Just Copy & Paste!
If you are familiar with Sentinel, you can skip to the scenarios section.
However, if you are not familiar, I urge you to continue reading to understand more about how to use Sentinel and KustoQL for the basics. This will help you confidently adapt the queries rather than simply running them without context.
Benefits of Using Sentinel
Kusto Query Language
Sentinel can target specific logging data using the Kusto Query Language and the representative Sentinel Data Table. Subsequently, it enables your organisation to quickly target logging data to provide a detailed breakdown of actions and activities that have occurred.
One of the key strengths of KustoQL is the ability to join multiple data tables, allowing analysts to correlate events that occur across different services. Since Microsoft telemetry is often distributed across several tables, this capability enables SOC teams to recreate sequences of audit events and gain a clearer understanding of administrative actions and activities that occurred in Microsoft Purview.
By consolidating and analysing logs in this way, Sentinel enables a more efficient and proactive approach to monitoring the Purview environment.
Sentinel Permissions
To access Sentinel and run KustoQL queries (including queries that reference Watchlists), you need read access to the Log Analytics workspace, such as:
- Microsoft Sentinel Reader, or
- Log Analytics Reader
- To create, edit, or delete Sentinel watchlists, you need Contributor-level access, such as:
- Microsoft Sentinel Contributor, or
- Log Analytics Contributor
For additional information on permissions, use the official Microsoft documentation link: Roles and permissions in the Microsoft Sentinel platform | Microsoft Learn
Conclusion
To conclude this section, while Purview’s default audit logs are effective, integrating Sentinel can significantly improve the efficiency and effectiveness of your logging, monitoring, and alerting processes. This integration allows for a more proactive approach to managing your Purview environment, helping you to identify potential breaches or suspicious administrative activities more effectively.
Not using Microsoft Sentinel yet? Now is a great time to switch it on. With several trials and adoption incentives available, organisations can start leveraging Sentinel as their SIEM and SOAR platform. All the while, securing an amazing deal in the process!
Next up, let us start learning Sentinel’s fundamentals.
Sentinel Fundamentals
Before you start utilising Sentinel, it is important to understand some of the basics. As a result, we will explore the following:
- Azure Log Analytics workspace: the need for and importance of storing data locally to Sentinel.
- Data Connectors: what they are and which ones are relevant for the logs we need.
- Watchlists: enabling targeted detection and response by separating trusted Purview administrators from untrusted or unexpected access.
- Query basics: how to craft and maximise the scope of a query, ensuring you are returning the data required.
- Columns and Values: What Columns and Values matter, and how to quickly visualise the information for ease of investigation.
Understanding these fundamentals will help ensure that the queries and detection scenarios presented later in this blog are clear and actionable.
Azure Log Analytics
Azure Log Analytics is the foundational data and analytics platform that hosts logging data for Microsoft Sentinel. It enables organisations to collect, store, and review logging data from a wide range of Microsoft and non-Microsoft sources.
Using the Kusto Query Language (KQL), Log Analytics allows analysts to perform advanced queries, correlate and join data across multiple tables, and extract meaningful insights. These capabilities are critical for identifying behavioural patterns, detecting anomalies, and supporting real‑time threat detection, investigation, and response within Microsoft Sentinel.
Data Connectors
Data connectors play a critical role in Microsoft Sentinel by ingesting security telemetry from Microsoft and third-party solutions into Log Analytics tables. This enables organisations to consolidate security-relevant data into a single analytics layer, where activity across multiple services can be correlated to produce deeper operational and security insights.
For this blog, we focus on the Microsoft Defender XDR data connector, and the data types it contributes to Microsoft Sentinel, specifically the CloudAppEvents table.
When this connector is enabled, advanced hunting events from Defender services are streamed into Microsoft Sentinel. This includes enhanced activity data originating from services such as Microsoft Defender for Cloud Apps. This telemetry provides a structured, security-focused view of administrative and user actions and activity that is significantly easier to query and correlate than working directly with raw logs in the Purview Default Audit logs.
Using this data, we can create targeted queries to detect scenarios such as when an administrator is granted or revoked access to a Microsoft Purview Role Based Access Control (RBAC) group.
Watchlists
Watchlists in Microsoft Sentinel provide an enhanced way to correlate and enhance Purview RBAC actions and activities with high-value reference data, enabling a more targeted detection and investigation. By importing datasets such as Microsoft Purview RBAC Groups and their approved administrators, or, where configured, Purview-related privileged access groups, your organisation can add this essential reference data to their Sentinel queries to provide enhanced analytics.
Watchlists are commonly used to identify activity involving sensitive roles, privileged users, or high-risk assets, helping security teams focus on the events that matter most. They can be leveraged across analytics rules, threat hunting queries, workbooks, and automated Playbooks, allowing organisations to tailor detections and investigations without modifying the underlying log sources.
This flexibility makes Watchlists especially effective for Purview monitoring scenarios, where understanding expected access versus unexpected access is essential. By correlating Purview audit and security events with curated RBAC watchlists, teams can more efficiently detect misconfigurations, privilege creep, and potentially malicious administrative activity.
For this blog post, we will be using a Watchlist to determine which administrators should have access and those who should not. This ensures that administrators who are not permitted to create and or manage Role Based Access Control Groups are alerted immediately.
Query Fundamentals
Do not worry if the full meaning of the query is not immediately clear. Focus on understanding the structure of the query first; the details of each operator will become clearer as we explore them further.
The Data Connector
Every KQL query starts with the schema defined by the Data Connector.
Each table represents a specific type of telemetry, and understanding which table to query is the first step in any investigation.
For example, telemetry ingested into Sentinel via the CloudAppEvents table represents user and administrative activity across cloud applications, including those aligned to this blog:
- Access Granted to RBAC Groups
- Access Revoked from RBAC Groups
- RBAC Groups Copied and Recreated
- Purview Sign-in Activities
The easiest way to think of this is, which dataset (table) best represents the activity you want to investigate?
The Schema
The schema defines the structure of the data you query in Sentinel. It is made up of tables and their associated columns, along with the data types of those columns.
Understanding the schema is essential because KustoQL operators work directly against these columns to filter, shape, and analyse the data you are investigating. Without this understanding, it is way too easy to write queries that are inefficient, misleading, or simply return no results at all. Trust me on this one, when I started learning, some of the returned results were wildly off!
The schema defines the following:
- Which columns exist
- What type of data each column holds
- What each column represents
To give you an idea of what a schema looks like, let us explore an example from our Connector of interest, the CloudAppEvents table.
Using the pipe (|) and the getschema operator, we can see how this table is structured.
Learning Tip: Try to type the query rather than copy/paste the query below. This is how I began to understand them.
CloudAppEvents
| getschema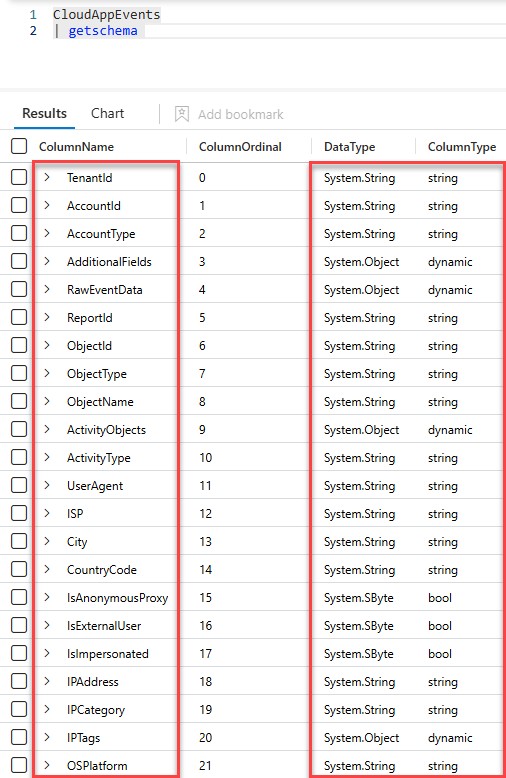
The columns highlighted on the left represent the fields we typically want to target when crafting KQL queries; these are the values we filter, project, and analyse.
The columns highlighted on the right describe how that data is structured, including the data type for each column. Understanding this helps you handle the data correctly and present query results in a way that is easier to read and interpret.
Every row in the CloudAppEvents table follows the same schema, even though the actual values may differ depending on the application, action, or user involved.
Understanding this structure allows you to:
- Filter effectively
- Join tables accurately
- Interpret results correctly
The Pipe
Kusto Query Language (KustoQL) uses the pipe operator (|) to pass the output of one operation as the input to the next. Each operator processes the results returned by the previous step, allowing you to filter, shape, or transform a dataset progressively.
Because each step builds on the previous one, KustoQL queries are read from left to right, making them intuitive to write and easy to understand, even for users without a background in programming.
Let’s look at a simple example using our CloudAppEvents table:
CloudAppEvents
| where TimeGenerated > ago(90d)
| where ActionType == "GrantPermissionsAsync"
| project TimeGenerated
Quick Tip: You can think of the pipe operator as a data production line, where data passes through a series of stages. At each stage, the dataset is filtered or reshaped before being passed to the next operator.
In this example, the query contains three stages defined by the (|):
- Two where operators
- One project operator
Each stage narrows or reshapes the dataset, allowing you to build more detailed queries step by step.
The where
The where operator filters rows based on conditions and is one of the most used operators in KustoQL. It is essential for improving accuracy, relevance, and query performance.
In Microsoft Sentinel, the where operator is commonly used to filter data based on:
- Time Ranges
- Action Types
- User Identities
- Administrative Activity
- Resource or Object Types
Let us look at an example in our query:
CloudAppEvents
| where TimeGenerated > ago(90d)
| where ActionType == "GrantPermissionsAsync"
| project TimeGenerated
This query performs the following steps:
- The CloudAppEvents table is selected as the data source.
- The first where statement filters events generated within the last 90 days.
- The second where statement further narrows the results to actions where permissions were granted.
- The project operator selects only the columns we want to display: TimeGenerated.
By chaining these operators together using the pipe, you can target the schema and values quickly to narrow down large volumes of log data to the specific actions and activities you want to investigate.
The extend
The extend operator allows you to create new, evaluated columns from existing data, helping you improve and interpret the results of a query without altering the underlying dataset. Essentially, extend adds a new column to the output by applying a calculation or expression to existing fields.
In the query below, the extend is used to create a new column called ActingAdmin, which extracts the ActingCallerId value from the RawEventData field so we can clearly identify the administrator who granted the permissions.
CloudAppEvents
| where TimeGenerated > ago(90d)
| where ActionType == "GrantPermissionsAsync"
| extend ActingAdmin = tostring(RawEventData.ActingCallerId)
When running this, you are also:
- Casting the value to a string using tostring()
- Extracting a field from a dynamic JSON object
The project
The project operator selects and displays only the specified columns from a query result. It helps simplify and focus the output by removing unnecessary fields while leaving the underlying dataset unchanged.
In the example we have been creating, the project is used to display only the most relevant columns from the results, allowing analysts to focus on the key information without being overwhelmed by unnecessary data.
CloudAppEvents
| where TimeGenerated > ago(90d)
| where ActionType == "GrantPermissionsAsync"
| extend ActingAdmin = tostring(RawEventData.ActingCallerId)
| project TimeGenerated, ActingAdmin, ActionType
The let
The let statement provides the ability to define and reuse named values, sub‑queries, or functions within a query, making complex queries cleaner and easier to maintain. It must appear at the top of the query and end with a semicolon. A key point is that let stores the referenced expression in the statement, not the result. Consequently, the expression is re-evaluated each time it is used, enabling us to include expressions for inclusion within the query.
Query Summary
The query uses several operators to filter and structure the results:
- where = filters the dataset to return only rows that meet specific conditions
- extend = creates new calculated columns based on existing data
- project = selects which columns are displayed in the final output
- let = defines reusable named values, sub‑queries, or functions
Columns and Values
Below is a table showing the RecordType, Operation Category, ActionType and Description values that can appear on the data. These fields help define the specific administrative activity being performed and allow you to refine your search when investigating events.
Table One: Sign-In Activity Events
| RecordType | Operation Category | Description |
| N/A | Sign-in activity | Successful sign-in |
| N/A | Sign-in activity | Failed sign-in |
Table Two: Purview RBAC Role Group Operations
| RecordType | ActionType | Description |
| 87 | CreateRBACRoleGroupDefinition | Created and or Copied an RBAC Role Group |
| 87 | UpdateRBACRoleGroupDefinition | Updated/Amended an RBAC Role Group |
| 87 | GrantPermissionsAsync | Granted Permissions to an RBAC Role Group |
| 87 | DeletePermissionAsync | Deleted Permissions from an RBAC Role Group |
| 87 | DeleteRBACRoleGroupDefinition | Deleted an RBAC Role Group |
If we break down what is in the table above and apply simple terms to it, we have the following:
- Columns & Values = the database structure
- Columns = the field names (RecordType, ActionType)
- Values = the entries inside those fields (GrantPermissionsAsync, DeletePermissionAsync, etc.)
- Action Types = the activity or behaviour being analysed
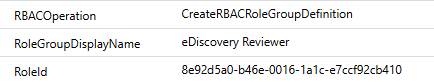
Using these Columns and Values enables you to return specific data from the CloudAppEvents table. For example, it can display the RBAC Group Name and or RBAC Group Guid, enhancing the investigation with meaningful data. See the image below that clearly displays the following information:
- RBAC Operation
- RBAC Group Name
- RBAC Group Guid
Watchlists
Let’s look at getting that important reference data for our Watchlists so you can include it in your queries.
Current Purview RBAC Group Membership
Firstly, I think you would agree, it’s best to first see who has a current membership to any RBAC role group. My preferred approach is to use PowerShell to extract the data directly from Purview via the IPPS module; the script for this is in my GitHub here.
Tip: Go and Grab it – Hopefully, there are no surprises!
Approved Purview Admins List
Hopefully, you already have a pre-defined list somewhere of your pre-approved Purview admins. If not, you can, of course, create one.
RBAC Watchlist Configuration
As you have learned up to now, a Watchlist enables you to associate reference data with Microsoft Sentinel so it can be evaluated alongside targeted log data during investigations. In line with this blog, a Watchlist will represent RBAC groups and their members, enabling this data to be correlated with activity captured in Sentinel logs.
For RBAC-focused scenarios, a Watchlist commonly includes:
- RBAC Group Name
- RBAC Group Object ID (GUID)
- User or Member identifiers (aka, UPN, Display Name or Object ID)
In this blog, I will share my experiences on the following examples:
- Admins added directly to Purview Role Groups
- Admins added to Entra Groups hosted by Purview Role Groups
Using this reference data, I will demonstrate how to investigate and report on (a) administrators granted Microsoft Purview roles and (b) administrators who should not have Purview access, helping to identify potentially risky or unauthorised access. I will also create two Watchlists, one for administrator identifiers and one for group identifiers, to focus subsequent queries on accounts that should not have Purview access, as demonstrated in the next section.
Configuration Tip: I highly recommend dynamically updating Watchlists from EntraID groups using a playbook. The design and configuration are covered here: Update Microsoft Sentinel VIP Users Watchlist from Azure AD group using playbooks | Microsoft Community Hub
Next, we will create the example Watchlists.
Approved Purview Admins
To create a Watchlist that hosts your approved Purview admins, follow the instructions below.
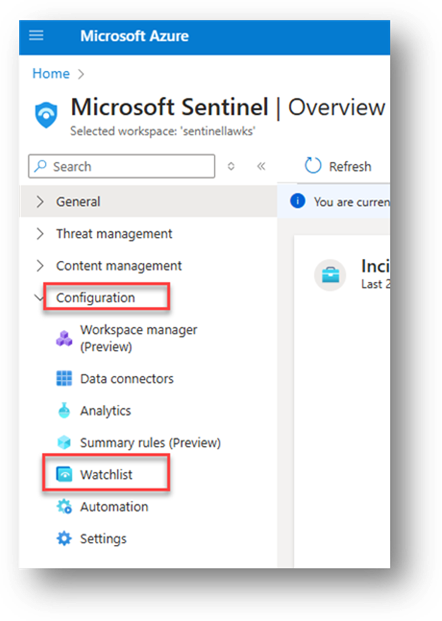
- Log into your Sentinel environment, navigate to Configuration and select Watchlist, as per the below example.
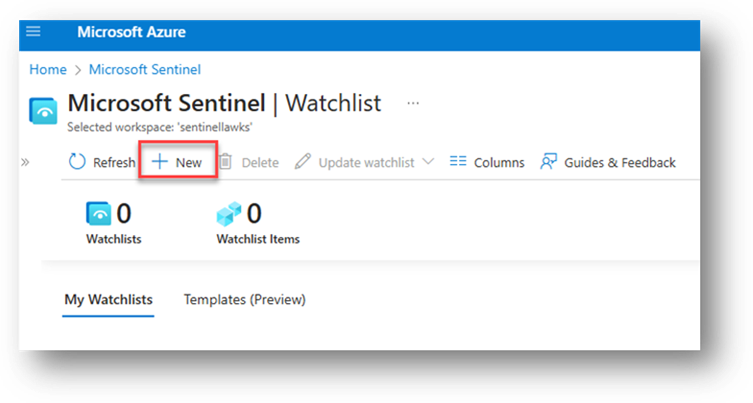
- Select New.
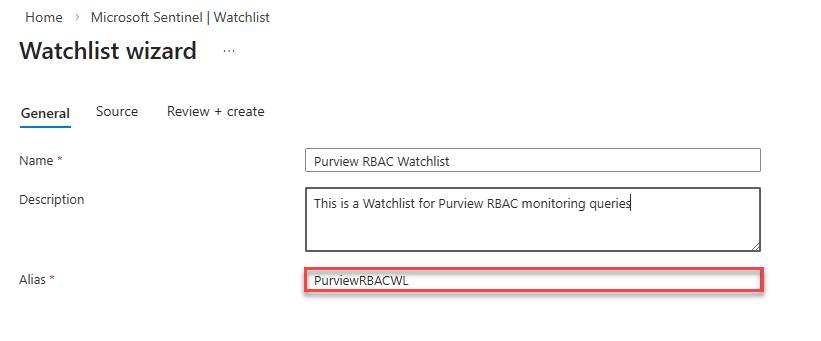
- Provide a Name, Description, and Alias
Note: The alias is what will be used in the query. I highly recommend you choose something relevant and easy to target in a query.
- Upload the CSV file you created in PowerShell and configure the SearchKey to Guid
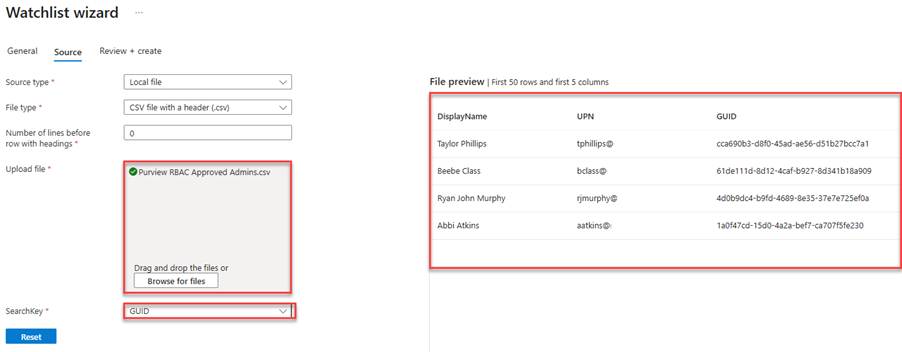
- Continue and Save the Watchlist
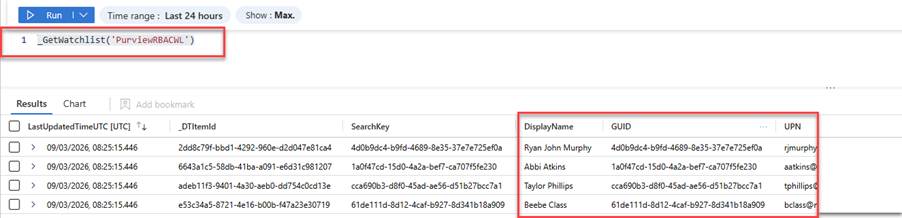
Navigate to Sentinel and open a new tab to run your Watchlist query. If you used the same name as I did during the configuration, your query will be as follows:
_GetWatchlist('PurviewRBACWL')
If you decided on your own name, you should use the query below.
_GetWatchlist('ADDYOURNAMEHERE')
You will now see the RBAC output with the referenced data you created:
Next, let’s look at how we can do this for M365 Groups that host your Purview admins in Entra ID Roles.
Entra ID Groups Hosted by Purview Roles
I am sure, like most of my customers, you have dedicated Security Groups created in Entra ID to host the Purview RBAC Groups for inclusion in solutions like Privileged Identity Management or to apply a group membership to Purview rather than direct membership to the role(s).
To reveal the members of these groups, you can use the following PowerShell script available on my GitHub (Pt1 Watch the Watchers). Thereafter, you can follow the same steps as above to create a Watchlist dedicated to your Purview Entra ID Groups.
Now that you have identified the groups that host the members for the Purview roles, you can reference them in the queries, enabling you to craft and target your queries on the Entra ID groups, also.
Putting it all into Practice
Now that you have covered the fundamentals of Microsoft Sentinel and how to craft meaningful KustoQL queries and create Watchlists, we can shift our focus to the workability of the Watch the Watchers, queries and generating that important data. This means understanding which queries, watchlists, columns and values within the logs reveal RBAC group modifications, such as role assignments, role group changes, and administrative actions. As you have learned thus far, targeting the correct fields allows you to investigate who signed in, who made the change(s), what was changed, and whether that action was appropriate.
Watch the Watchers Scenarios
Throughout this section, we will start to see how important Sentinel can be for our Watch the Watchers scenarios. More so, how the queries can extract valuable information, facilitating a proficient RBAC reporting solution.
An important consideration in your Microsoft Sentinel journey is understanding how data retention is applied. Sentinel stores all ingested telemetry within the underlying Log Analytics Workspace, and retention is configured at either the workspace or table level.
By default, Log Analytics retains data for approximately 30 days, although Sentinel‑connected workspaces include up to 90 days of analytics retention at no additional cost if configured. Organisations can extend the retention period up to two years, with further long‑term retention available through archive tiers. Ten years is what some of my regulated customers enable.
Retention should always align with your organisation’s investigative and regulatory requirements. If your queries are only returning recent results (for example, less than one year), this is typically due to the analytics retention configured on the relevant workspace or table. On the contrary, if you’re required to investigate data as far back as thirty, sixty, or ninety days, you can simply edit the timeline to one of the following:
- Thirty-Days = (30d)
- Sixty-Days = (60d)
- Ninety-Days = (90d)
- One-Year = (365d)
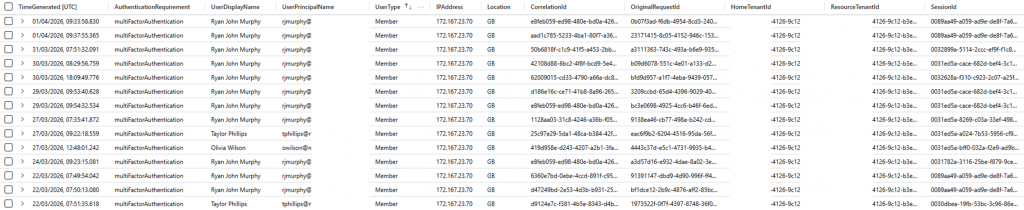
Scenario One: Successful Sign Ins
To understand who has successfully logged into the Purview Portal. Use the following query:
//Successful Sign In – Purview Portal
SigninLogs
| where TimeGenerated > ago(90d)
| where AppDisplayName == ("Microsoft 365 Security and Compliance Center")
| where ResultType == 0
| project TimeGenerated, AuthenticationRequirement, UserDisplayName, UserPrincipalName, UserType, IPAddress, Location, SourceSystem, CorrelationId, OriginalRequestId, HomeTenantId, ResourceTenantId, SessionId
This will provide the following output with your organisational data:
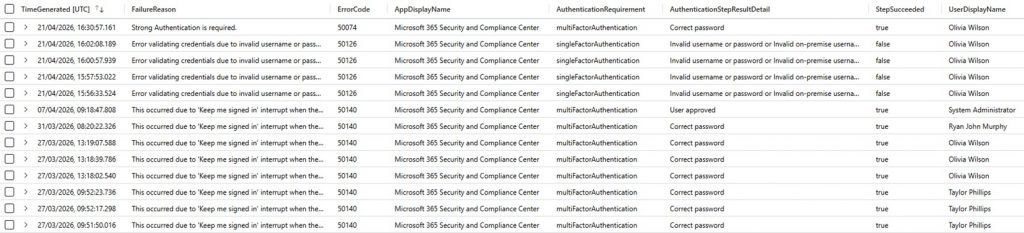
Scenario Two: Failed Sign Ins
To understand who is failing to log into the Purview Portal. Use the following query:
//Failed Sign In – Purview Portal
SigninLogs
| where TimeGenerated > ago(90d)
| where AppDisplayName == "Microsoft 365 Security and Compliance Center"
| where ResultType != 0   // definitive failure
| extend AuthDetails = parse_json(AuthenticationDetails)
| extend AuthDetails = parse_json(AuthenticationDetails)
| extend authenticationMethodDetail= tostring(AuthDetails[0].authenticationMethod)
| extend authenticationMethodDetail = tostring(AuthDetails[0].authenticationMethodDetail)
| extend authenticationStepDateTime = tostring(AuthDetails[0].authenticationStepDateTime)
| extend authenticationStepRequirement = tostring(AuthDetails[0].authenticationStepRequirement)
| extend AuthenticationStepResultDetail = tostring(AuthDetails[0].authenticationStepResultDetail)
| extend StepSucceeded = tostring(AuthDetails[0].succeeded)
| extend browser = tostring(DeviceDetail.browser)
| extend operatingSystem = tostring(DeviceDetail.operatingSystem)
| extend city = tostring(LocationDetails.city)
| extend ErrorCode = tostring(Status.errorCode)
| extend FailureReason = tostring(Status.failureReason)
| project TimeGenerated,FailureReason,ErrorCode,AppDisplayName,AuthenticationRequirement,AuthenticationStepResultDetail,StepSucceeded,UserDisplayName,UserPrincipalName,UserType,IPAddress,Location,city,browser,operatingSystem,SourceSystem,CorrelationId,OriginalRequestId,HomeTenantId,ResourceTenantId,SessionId
This will provide the following output with your organisational data:
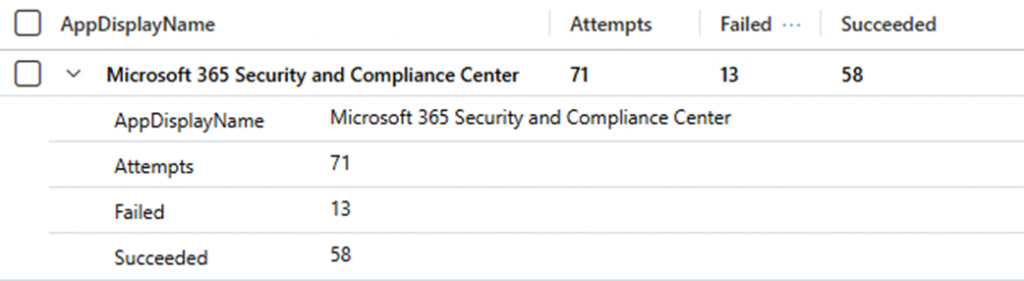
Scenario Three: Sign In Chart
To create a Sign-in Chart for publication into a Sentinel Workbook, and/or a Power BI report. Use the following query:
SigninLogs
| where TimeGenerated > ago(90d)
| where AppDisplayName == "Microsoft 365 Security and Compliance Center"
| summarize Attempts=count(), Failed=countif(ResultType != 0),Succeeded=countif(ResultType == 0) by AppDisplayName
This will provide the following output with your organisational data:
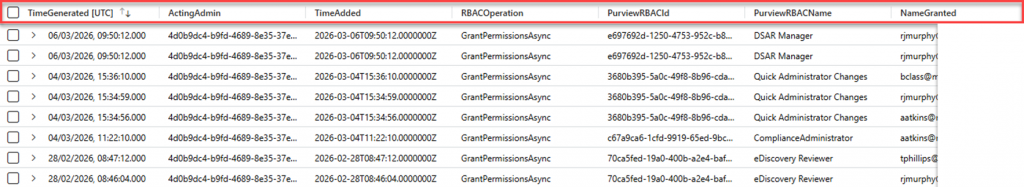
Scenario Four: Permissions Granted
As we have learned thus far, it is vital to monitor and control who is granted access to Microsoft Purview roles. Unmonitored or inappropriate access can introduce security and compliance risks, particularly if permissions are assigned to individuals who are not approved Purview administrators. Without proper oversight, elevated access could be misused, intentionally or unintentionally, to access sensitive data, alter compliance configurations, or undermine investigations.
To understand who has been granted permissions to any Purview Roles. Use the following query.
// Permissions Granted ALL Purview Roles
CloudAppEvents
| where TimeGenerated > ago(90d)
| where ActionType == "GrantPermissionsAsync"
| extend ActingAdmin = tostring(RawEventData.ActingCallerId)
| extend ApplicationID = tostring(RawEventData.AppId)
| extend TimeAdded = tostring(RawEventData.CreationTime)
| extend RBACOperation = tostring(RawEventData.Operation)
| extend PreExecutionMessage = tostring(RawEventData.PreExecutionMessage)
| extend DirectInfo = extract(@"\{.*", 0, PreExecutionMessage)
| extend PreExecutionJson = parse_json(DirectInfo)
| extend NameGranted = tostring(PreExecutionJson.MemberDetail.MemberDisplayName)
| extend PurviewRBACId = tostring(PreExecutionJson.RoleGroupDetail.RoleGroupId)
| extend PurviewRBACName = tostring(PreExecutionJson.RoleGroupDetail.RoleGroupName)
| project TimeGenerated, ActingAdmin, TimeAdded, RBACOperation, PurviewRBACId, PurviewRBACName, NameGranted
This will provide the following output with your organisational data:
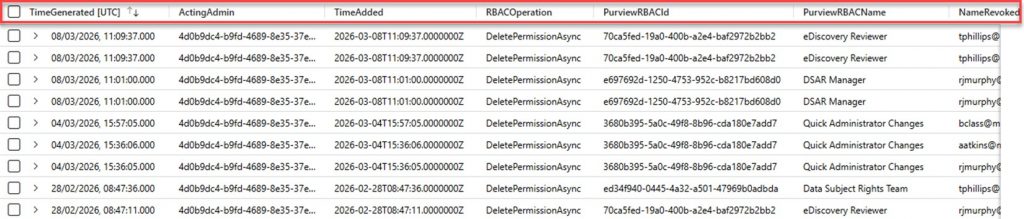
Scenario Five: Permissions Revoked
To understand who has been revoked permissions to any Purview Roles. Use the following query.
// Permissions Revoked ALL Purview Roles
CloudAppEvents
| where TimeGenerated > ago(90d)
| where ActionType == "DeletePermissionAsync"
| extend ActingAdmin = tostring(RawEventData.ActingCallerId)
| extend ApplicationID = tostring(RawEventData.AppId)
| extend TimeAdded = tostring(RawEventData.CreationTime)
| extend RBACOperation = tostring(RawEventData.Operation)
| extend PreExecutionMessage = tostring(RawEventData.PreExecutionMessage)
| extend DirectInfo = extract(@"\{.*", 0, PreExecutionMessage)
| extend PreExecutionJson = parse_json(DirectInfo)
| extend NameRevoked = tostring(PreExecutionJson.MemberDetail.MemberDisplayName)
| extend PurviewRBACId = tostring(PreExecutionJson.RoleGroupDetail.RoleGroupId)
| extend PurviewRBACName = tostring(PreExecutionJson.RoleGroupDetail.RoleGroupName)
| project TimeGenerated, ActingAdmin, TimeAdded, RBACOperation, PurviewRBACId, PurviewRBACName, NameRevoked
This will provide the following output with your organisational data:
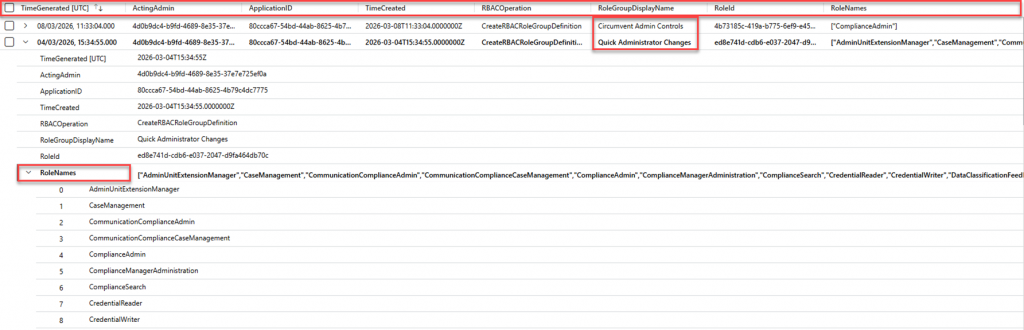
Scenario Six: Created or Copied Roles
To understand who has created or copied a Purview Role. Use the following query.
// RBAC Roles Created or Copied
CloudAppEvents
| where TimeGenerated > ago(90d)
| where ActionType == "CreateRBACRoleGroupDefinition"
| extend ActingAdmin = tostring(RawEventData.ActingCallerId)
| extend ApplicationID = tostring(RawEventData.AppId)
| extend TimeCreated = tostring(RawEventData.CreationTime)
| extend RBACOperation = tostring(RawEventData.Operation)
| extend PreExecutionMessage = tostring(RawEventData.PreExecutionMessage)
| extend RoleGroupDisplayName = extract(@"RoleGroupDisplayName"":\s*""([^""]+)""", 1, PreExecutionMessage)
| extend RoleId = extract(@"RoleId"":\s*""([^""]+)""", 1, PreExecutionMessage)
| extend RoleNames = extract_all(@"RoleName"":\s*""([^""]+)""", PreExecutionMessage)
| project TimeGenerated,ActingAdmin,ApplicationID,TimeCreated,RBACOperation,RoleGroupDisplayName,RoleId,RoleNames
This will provide the following output with your organisational data:
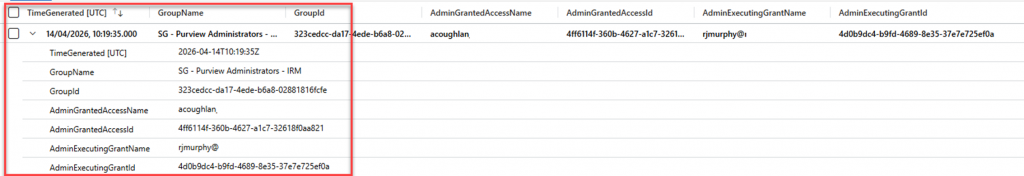
Scenario Seven: EntraID Groups Hosted by Purview Roles
In this query, the let statement has been utilised to incorporate the EntraID Group Name. Including this detail is a requirement, as it enables a targeted request for the user(s) access assigned to the Group, which is hosted by the appropriate Purview RBAC Group.
If, like me, you have a naming convention you must follow, you can manipulate this into your query as your reference data. I create my security groups with the following naming conventions:
- SG – Purview Administrators – MIP
- SG – Purview Administrators – IRM
- SG – Purview Administrators – DLP
I’ve used a let statement to capture the standard naming prefix (“SG – Purview Administrators”), then filtered on GroupName using contains_cs so the query matches every group that follows the same naming convention, whilst not being case sensitive.
To retrieve this information, use the query below.
// M365 Group Hosted Permissions for Purview RBAC
let EntraIDGroupName = "SG - Purview Administrators"; //Add your Entra ID Group Name that is hosted in Purview
CloudAppEvents
| where TimeGenerated >ago(90d)
| where ActionType == "Add member to group." //The target value requires the full stop!
| extend GroupName = tostring(parse_json(tostring(RawEventData.ModifiedProperties))[1].NewValue)
| extend GroupId = tostring(parse_json(tostring(RawEventData.ModifiedProperties))[0].NewValue)
| where GroupName startswith  (EntraIDGroupName)
| extend AdminGrantedAccessName = tostring(RawEventData.ObjectId)
| extend AdminGrantedAccessId = tostring(ActivityObjects[1].Id)
| extend AdminExecutingGrantName = tostring(parse_json(tostring(RawEventData.Actor))[0].ID)
| extend AdminExecutingGrantId = tostring(parse_json(tostring(RawEventData.Actor))[3].ID)
| project TimeGenerated,GroupName,GroupId,AdminGrantedAccessName,AdminGrantedAccessId,AdminExecutingGrantName,AdminExecutingGrantId
This will provide the following output with your organisational data:
Next, let us bring that Watchlist into the query to provide a more targeted approach to what is happening with your Purview Roles Based Access Control Groups.
Watch the Watchers with a Watchlist Scenarios
With a Watchlist included in your Watch the Watchers scenarios, things get a lot more interesting. You can now start to look for administrative access that is unapproved or undetected by your Security Operations Centre or equivalent. When targeting the Grant Permissions output, you can see that the provided metadata value is NameGranted. You can use this as a source value in your query to state where NameGranted is not detected in the Watchlist. As a result, any user/admin that has not been approved to access Purview will be displayed and the Role Group they were granted access to. Perfect!
To achieve this, we need to amend our query slightly to include the Watchlist for the query to a) detect the details within the Watchlist and b) what names are reported back in the query and where there is no match.
Here is where we introduce two new lines into our query, detailed below:
- let watchlistRBAC = (_GetWatchlist(‘PurviewRBACWL’));
- Includes the approved admins’ Watchlist data in the query for analysis.
- | where NameGranted !in (“WatchlistRBAC”)
- Defines where the Name Granted to the Role is not in our approved list
- The !in specifies where the Name Granted is not in our approved list
In the example below, I added the user A Garner to the Compliance Administrator Role. However, I know A Garner should not have access to any Purview Roles as this is not their area of responsibility. As a result, the Watchlist data was assessed, reasoned over, and then referenced against the NameGranted value. It detected that an unapproved name was not present in our Watchlist; therefore, it generated the following output.
You can, of course, do the same for an M365 Group.
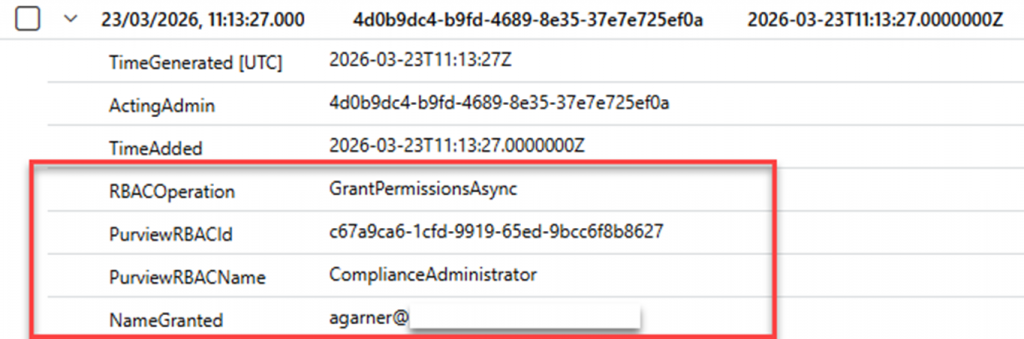
Scenario One: Permissions Granted for Non-Admin Account
To understand who has been granted unapproved permissions to any Purview Roles.
// Permissions Granted ALL Purview Roles, !in Watchlist Approved
let watchlistRBAC = (_GetWatchlist('PurviewRBACWL'));
CloudAppEvents
| where TimeGenerated > ago(90d)
| where ActionType == "GrantPermissionsAsync"
| extend ActingAdmin = tostring(RawEventData.ActingCallerId)
| extend ApplicationID = tostring(RawEventData.AppId)
| extend TimeAdded = tostring(RawEventData.CreationTime)
| extend RBACOperation = tostring(RawEventData.Operation)
| extend PreExecutionMessage = tostring(RawEventData.PreExecutionMessage)
| extend DirectInfo = extract(@"\{.*", 0, PreExecutionMessage)
| extend PreExecutionJson = parse_json(DirectInfo)
| extend NameGranted = tostring(PreExecutionJson.MemberDetail.MemberDisplayName)
| where NameGranted !in ("WatchlistRBAC")
| extend PurviewRBACId = tostring(PreExecutionJson.RoleGroupDetail.RoleGroupId)
| extend PurviewRBACName = tostring(PreExecutionJson.RoleGroupDetail.RoleGroupName)
| project TimeGenerated, ActingAdmin, TimeAdded, RBACOperation, PurviewRBACId, PurviewRBACName, NameGranted
This will provide the following output with your organisational data:
Permissions Granted for Non-Admin Account EntraID Groups and Watchlists
I am sure by now you know what to do. Why not have a go yourself? Try and replicate the query needed for the EntraID groups scenario above by creating another watchlist specifically for your dedicated Purview Entra ID groups. If you struggle, the KustoQL is in my GitHub.
Closing Comments
That is, you are now up and running with Sentinel for Purview. I hope this has been helpful and has sparked ideas for using Sentinel for Purview logging, monitoring, and alerting. In part two of this series, we will shift focus to tracking administrative changes to Information Protection and Data Loss Prevention policies.